State Health Insurance Marketplace Enrollment (Plan Selections) 2017 and 2018
Press Release: Individual Marketplace Enrollment Remains Stable in the Face of National Uncertainty
Click here to view or download .pdf version of chart.
State-Based Marketplaces (SBMs) [1]
| State | Enrollment (Plan Selections) Plan Year 2017 | Enrollment (Plan Selections) Plan Year 2018 | Percentage Change in Plan Selections 2017 to 2018 |
|---|---|---|---|
| California | 1,556,676 | 1,521,524 | -2.26% |
| Colorado | 161,568 | 165,777 | 2.61% |
| Connecticut | 111,542 | 114,134 | 2.32% |
| District Of Columbia | 21,248 | 22,469 | 5.75% |
| Idaho | 100,082 | 94,507 | -5.57% |
| Massachusetts | 266,664 | 270,688 | 1.51% |
| Maryland | 157,832 | 153,584 | -2.69% |
| Minnesota | 109,974 | 116,358 | 5.81% |
| New York | 242,880 | 253,102 | 4.21% |
| Rhode Island | 29,456 | 33,021 | 12.10% |
| Vermont | 30,682 | 28,762 | -6.26% |
| Washington | 225,594 | 242,850 | 7.65% |
| Total SBMs | 301,4198 | 3,016,776 | 0.09% |
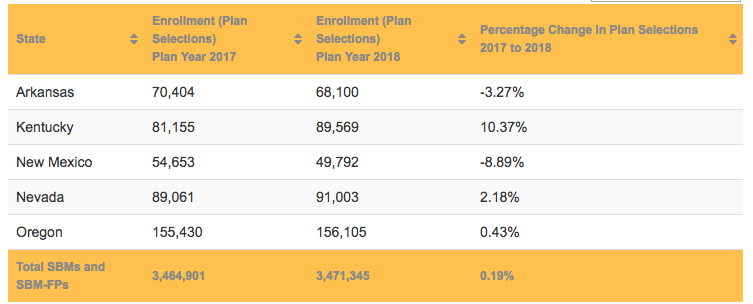
State-Based Marketplaces Using the Federal Platform (SBM-FPs) [2]
| State | Enrollment (Plan Selections) Plan Year 2017 | Enrollment (Plan Selections) Plan Year 2018 | Percentage Change in Plan Selections 2017 to 2018 |
|---|---|---|---|
| Arkansas | 70,404 | 68,100 | -3.27% |
| Kentucky | 81,155 | 89,569 | 10.37% |
| New Mexico | 54,653 | 49,792 | -8.89% |
| Nevada | 89,061 | 91,003 | 2.18% |
| Oregon | 155,430 | 156,105 | 0.43% |
| Total SBM-FPs | 450,703 | 454,569 | 0.86% |
| Total SBMs and SBM-FPs | 3,464,901 | 3,471,345 | 0.19% |
Federally-Facilitated Marketplace (FFM) States [3]
| State | Enrollment (Plan Selections) Plan Year 2017 | Enrollment (Plan Selections) Plan Year 2018 | Percentage Change in Plan Selections 2017 to 2018 |
|---|---|---|---|
| Alaska | 19,145 | 18,313 | -4.35% |
| Alabama | 178,414 | 170,211 | -4.60% |
| Arizona | 196,291 | 165,758 | -15.55% |
| Delaware | 27,584 | 24,500 | -11.18% |
| Florida | 1,760,025 | 1,715,227 | -2.55% |
| Georgia | 493,880 | 480,912 | -2.63% |
| Hawaii | 18,938 | 19,799 | 4.55% |
| Iowa | 51,573 | 53,217 | 3.19% |
| Illinois | 356,403 | 334,979 | -6.01% |
| Indiana | 174,611 | 166,711 | -4.52% |
| Kansas | 98,780 | 98,238 | -0.55% |
| Louisiana | 143,577 | 109,855 | -23.49% |
| Maine | 79,407 | 75,809 | -4.53% |
| Michigan | 321,451 | 293,940 | -8.56% |
| Missouri | 244,382 | 243,382 | -0.41% |
| Mississippi | 88,483 | 83,649 | -5.46% |
| Montana | 52,473 | 47,699 | -9.10% |
| North Carolina | 549,158 | 519,803 | -5.35% |
| North Dakota | 21,982 | 22,486 | 2.29% |
| Nebraska | 84,371 | 88,213 | 4.55% |
| New Hampshire | 53,024 | 49,573 | -6.51% |
| New Jersey | 295,067 | 274,782 | -6.87% |
| Ohio | 238,843 | 230,127 | -3.65% |
| Oklahoma | 146,286 | 140184 | -4.17% |
| Pennsylvania | 426,059 | 389,081 | -8.68% |
| South Carolina | 230211 | 215,983 | -6.18% |
| South Dakota | 29,622 | 29,652 | 0.10% |
| Tennessee | 234,125 | 228,646 | -2.34% |
| Texas | 1,227,290 | 1,126,838 | -8.18% |
| Utah | 197,187 | 194,118 | -1.56% |
| Virginia | 410,726 | 400,015 | -2.61% |
| Wisconsin | 242,863 | 225,435 | -7.18% |
| West Virginia | 34,045 | 27,409 | -19.49% |
| Wyoming | 24,826 | 24,529 | -1.20% |
| Total FFM | 8,751,102 | 8,289,073 | -5.28% |
National Marketplace Enrollment 2016 to 2018
| Summaries | Plan Year 2016 | Plan Year 2017 | Plan Year 2018 | Percentage Change in Plan Selections 2017 to 2018 | Percentage Change in Plan Selections 2016 to 2018 |
|---|---|---|---|---|---|
| National Total | 12,681,874 | 12,216,003 | 11,760,418 | -3.73% | -7.27% |
| FFMs Only | 9,262,215 | 8,751,102 | 8,289,073 | -5.28% | -10.51% |
| SBMs and SBM-FP Only | 3,419,659 | 3,464,901 | 3,471,345 | 0.19% | 1.51% |
[1] State-based marketplaces (SBM) design their enrollment websites, control outreach and marketing, and manage the health plans offered through the marketplace. This data came from publically available sources or directly from the marketplace.
[2] These state-based marketplaces use the federal platform or website (SBM-FP) but control their outreach and manage the health plans offered through their marketplaces. The enrollment platform (including the website) is controlled by the FFM. Data reported is from Final Weekly Enrollment Snapshot For 2018 Open Enrollment Period, Dec. 28, 2017. https://www.cms.gov/Newsroom/MediaReleaseDatabase/Fact-sheets/2017-Fact-Sheet-items/2017-12-28.html?DLPage=1&DLEntries=10&DLSort=0&DLSortDir=descending
[3] States with federally-facilitated marketplaces (FFM) rely on the federal government to operate all functions of their marketplace, including enrollment websites, outreach, and plan management. In some cases, state departments of insurance have varying levels of outreach or management of health plans offered through the marketplace. Data reported from Final Weekly Enrollment Snapshot for 2018 Open Enrollment Period, Dec. 28, 2017. https://www.cms.gov/Newsroom/MediaReleaseDatabase/Fact-sheets/2017-Fact-Sheet-items/2017-12-28.html?DLPage=1&DLEntries=10&DLSort=0&DLSortDir=descending

 For individuals living with complex, often chronic conditions, and their families, palliative care can provide relief from symptoms, improve satisfaction and outcomes, and help address critical mental and spiritual needs during difficult times. Now more than ever, there is growing recognition of the importance of palliative care services for individuals with serious illness, such as advance care planning, pain and symptom management, care coordination, and team-based, multi-disciplinary support. These services can help patients and families cope with the symptoms and stressors of disease, better anticipate and avoid crises, and reduce unnecessary and/or unwanted care. While this model is grounded in evidence that demonstrates improved quality of life, better outcomes, and reduced cost for patients, only a fraction of individuals who could benefit from palliative care receive it.


